
|
Physical and Optical Structures in the Upper Ocean of the East (Japan) Sea Researchers Craig M. Lee, craig@apl.washington.edu Applied Physics Laboratory, University of Washington 1013 NE 40th Street Seattle, WA 98105 URL: iop.apl.washington.edu Kenneth H. Brink, kbrink@whoi.edu Woods Hole Oceanographic Institution Woods Hole, MA 02543 Burton H. Jones, bjones@usc.edu Department of Biological Sciences University of Southern California Los Angeles, CA 90089-0371 Award Numbers N00014-98-1-0344 N00014-98-1-0369 N00014-05-1-0644 N00014-98-1-0370 Objectives We seek to understand the processes that control physical and bio-optical variability in the upper ocean of the East/Japan Sea. Specifically, we are interested in:
Two cruises, the first in May 1999 followed by a second in January 2000, sampled upper ocean and atmospheric boundary layer (Drs. C. Dorman, SIO, R. Beardsley and J. Edson, WHOI) variability in the Japan/East Sea. The spring cruise focused on frontal dynamics, characterizing bio-optical variability associated with the spring phytoplankton bloom and documenting the location, range and properties of water masses formed at the subpolar front during the preceding winter. The wintertime cruise documented the upper ocean response to a series of cold air outbreaks with particular attention to processes associated with water mass formation and subduction at the subpolar front. Both cruises employed a towed, undulating profiler (SeaSoar) to make highly-resolved observations of the upper ocean. We used real-time remotely sensed sea surface temperature and ocean color images (R. Arnone and R. Gould, NRL) to determine the location of the subpolar front and to select intensive survey locations. Real-time access to remotely sensed imagery allowed us to modify our sampling in response to changes in the front. Repeated intensive grid surveys provided approximately synoptic, three-dimensional coverage while a sequence of longer sections documented oceanic and atmospheric boundary layer variability away from the front. In addition to the suite of physical and bio-optical sensors carried by SeaSoar, we employed a shipboard Acoustic Doppler Current Profiler (ADCP) and GPS navigation to measure upper ocean currents. Sampling included a limited number of hydrographic stations and optical profiles off the Korean coast and across the subpolar front. Professor S. Yang (Kwangju University) was responsible for additional biological and bio-optical sampling (e.g., nutrient analysis, pigments). Dr. M. Suk (KORDI) and colleagues provided additional support. Both spring and winter cruises involved scientists from the United States, Korea and Russia and included specialists in physical oceanography, biological oceanography, bio-optics, boundary layer meteorology and remote sensing. Motivated by the presence of a clearly defined, strong front, both spring and summer cruises sampled nearly identical regions situated over the northern side of the Yamoto Rise. SeaSoar sampling included intensive, quasi-synoptic surveys spanning a region roughly 100 km by 100 km. During winter, several sections extended farther north to encompass a warm eddy sitting just north of the subpolar front and to investigate marine atmospheric boundary layer structure as a function of distance from the source of the Siberian cold air outbreaks. Shipboard sensors made continuous measurements of meteorological variability while atmospheric soundings were carried out each day to obtain vertical profiles of temperature, humidity, pressure and winds. Underway measurements of absorption, scattering, attenuation and remote sensing reflectance were also collected (Dr. R. Arnone, NRL). Analysis efforts investigated intra-thermocline eddies found south of the subpolar front, employed SeaSoar observations to assist with an evaluation of the Navy's MODAS operational climatology and nowcast/forecast system and investigated the dynamics of wind- and buoyancy-forced fronts and subduction. The collaborative intra-thermocline eddy study characterizes the large pycnostads found in selected locations south of the subpolar front and presents evidence suggesting that subduction at steep meanders may be responsible for their generation [Gordon et al., 2002]. Theoretical and numerical studies conducted by Leif Thomas, a University of Washington postdoc, suggest that Ekman frontogenesis and symmetric instability may be responsible for the formation of strong fronts and for accelerated vertical transports during intense wintertime forcing [Thomas and Lee, 2005]. Evaluations of Japan/East Sea MODAS performance using remote sensing and SeaSoar measurements revealed weaknesses in the model's ability to extrapolate accurate vertical structure from surface measurements and illustrated potential pitfalls resulting from mismatches between observed short temporal/spatial scales relative to the longer scales measured by remote sensing [Fox et al., 2002]. Collaborations with K-I Chang (KORDI) have resulted in an overview paper examining circulation in the southwestern Japan/East Sea. Ongoing collaboration between Yutaka Yoshikawa (Kyushu University), Thomas and Lee will produce a final set of papers detailing observations of watermass formation and subduction at the subpolar front and numerical simulations focused on exploring the dominant dynamics. Results Strong wintertime forcing by outbreaks of cold, dry Siberian air may drive intermediate water formation and subduction at the subpolar front of the Japan/East Sea. The subpolar front separates warm, saline southern waters from seasonally stratified, colder, fresher waters that lie to the north. Observations taken south of the front during spring and summer reveal subsurface pycnostads having elevated levels of dissolved oxygen and watermass characteristics consistent with those expected of waters formed in wintertime at the front. In January 2000, four repeat surveys sampled subpolar front evolution through three cold air outbreaks. High-resolution across-front sections reveal O(10 km) scale lenses embedded in the pycnocline just south of the frontal interface (Figure 1a). These features exhibit anti-cyclonic circulation and have salinities, chlorophyll fluorescence and 2-D potential vorticities similar to those found in the mixed layers north of the front. Significantly, the tilting term ∂u/∂z x ∂sq/∂y often causes potential vorticity to be negative at the frontal interface, producing symmetric instability and facilitating rapid vertical exchange of fluid. Comparisons of isopycnal and zonal absolute momentum (M = ug - fy, where ug is the geostrophic zonal velocity surfaces) highlights symmetrically unstable regions (Figure 1b). When isopycnals slope more steeply than ZAM surfaces, water parcels (tubes) displaced along isopycnals undergo meridional acceleration away from their original location, driving rapid southward transport into the pycnocline. Wintertime cold air outbreaks produce intense negative windstress curl and buoyancy loss over our survey region, both of which act to amplify the tilting term and produce negative potential vorticity. Comparisons of the absolute (planetary + relative) and tilting terms for the regions within 20 km of the front reveal marked contrasts between the two survey periods. In winter, the tilting term produces negative potential vorticity in approximately 8% of the data (Figure 2), while in spring, when atmospheric forcing is weak, the tilting term remains small and none of the sections exhibit negative potential vorticity. Thomas and Lee (2005) discuss mechanisms for frontal intensification through forcing by down-front winds. Down-front winds can drive Ekman transport of dense, cold-side waters across the front, producing convective overturning and driving frontogenic ageostrophic secondary circulations. The resulting effective buoyancy flux can be written as: 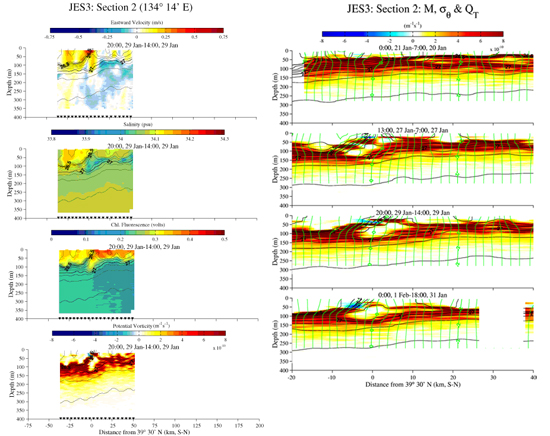 Figure 1. (a) Wintertime cross-front section with eastward velocity, salinity, chlorophyll fluorescence and 2-D potential vorticity colored over σθ contours. Triangles mark the locations of SeaSoar profiles. An anticyclonic lens sits between 50-150 m, just south of the front. Waters in the lens are relatively fresh, exhibit elevated chlorophyll fluorescence and low potential vorticity, similar to properties within the north-side mixed layer. (b) Zonal absolute momentum surfaces (green) and isopycnals (black) with 2-D potential vorticity for the four repeat occupations of a wintertime section. Note the change in vertical and horizontal scales from (a). Regions with negative potential vorticity, where isopynals slope more steeply then ZAM surfaces, are symmetrically unstable.. 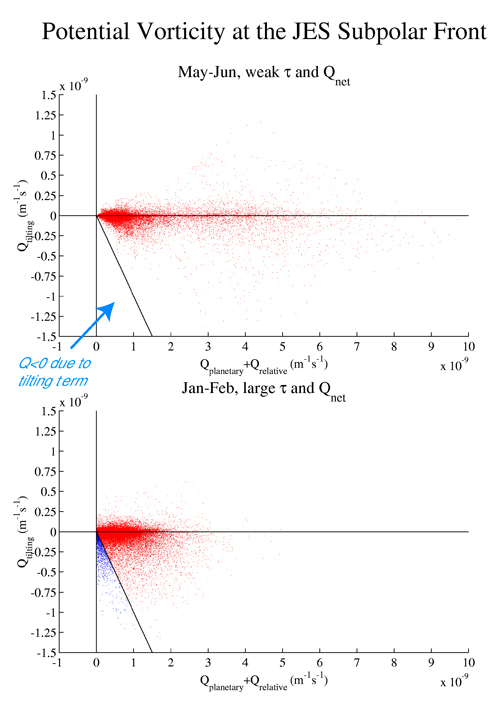 Figure 2. Potential vorticity (absolute and tilting terms) calculated at all points within 20 km of the subpolar front (as defined by density gradient maxima), from all sections occupied in spring 1999 and winter 2000. Atmospheric forcing was weak in springtime and strong (intense winds and surface buoyancy loss) in winter. Blue points mark negative potential vorticity produced by the tilting term. Negative potential vorticity appears only in the wintertime sections. 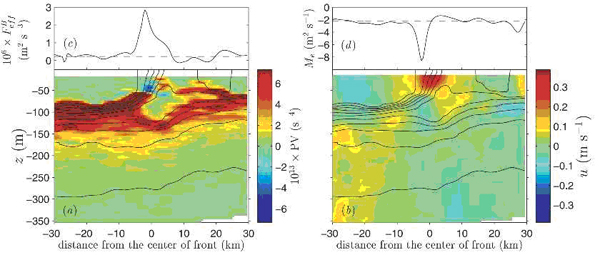 Figure 3. (from Thomas and Lee, 2005) Cross sections of density (black contours), (a) two-dimensional PV, and (b) alongfront velocity at the subpolar front of the Japan/East Sea during a cold-air outbreak on 31 Jan 2000. (c) The effective buoyancy flux (solid) is strongly destabilizing at the front owing to its wind-driven component, which peaks at nearly 10 times (dashed). (d) Ekman transport (solid) departs from the classical formula (dashed line) because of the vertical vorticity of the frontal jet. References Fox, D.N., W.J. Teague, C.N. Barron, M.R. Carnes, and C M. Lee, The Modular Ocean Data Assimilation System (MODAS), Journal of Atmospheric and Oceanic Technology, 19(2), 240-252, 2002. Gordon, A.L., C.F. Giulivi, C.M. Lee, A. Bower, H.H. Furey, and L. Talley, Japan/East Sea intra-thermocline eddies, Journal of Physical Oceanography, 32(6), 1960-1974, 2002. Thomas, L., and C.M. Lee, Intensification of ocean fronts by down-front winds, Journal of Physical Oceanography, 35(6), 1086-1102, 2005. |